Anatomy Of A Feedback Control System
Here is the classic block diagram of a process under PID Control.
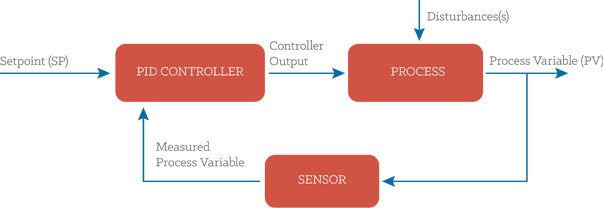
What’s going on this diagram?
The Setpoint (SP) is the value that we want the process to be.
For example, the temperature control system in our house may have a SP of 22°C. This means that
“we want the heating and cooling process in our house to achieve a steady temperature of as close to 22°C as possible”
The PID controller looks at the setpoint and compares it with the actual value of the Process Variable (PV). Back in our house, the box of electronics that is the PID controller in our Heating and Cooling system looks at the value of the temperature sensor in the room and sees how close it is to 22°C.
If the SP and the PV are the same – then the controller is a very happy little box. It doesn’t have to do anything, it will set its output to zero.
However, if there is a disparity between the SP and the PV we have an error and corrective action is needed. In our house this will either be cooling or heating depending on whether the PV is higher or lower than the SP respectively.
Let’s imagine the temperature PV in our house is higher than the SP. It is too hot. The air-con is switched on and the temperature drops.
The sensor picks up the lower temperature, feeds that back to the controller, the controller sees that the “temperature error” is not as great because the PV (temperature) has dropped and the air con is turned down a little.
This process is repeated until the house has cooled down to 22°C and there is no error.
Then a disturbance hits the system and the controller has to kick in again.
In our house the disturbance may be the sun beating down on the roof, raising the temperature of the air inside.
So that’s a really, really basic overview of a simple feedback control system. Sounds dead simple eh?
Understanding the controller
Unfortunately, in the real world we need a controller that is a bit more complicated than the one described above, if we want top performance form our loops. To understand why, we will be doing some “thought experiments” where we are the controller.
When we have gone through these thought experiments we will appreciate why a PID algorithm is needed and why/how it works to control the process.
We will be using the analogy of changing lanes on a freeway on a windy day. We are the driver, and therefore the controller of the process of changing the car’s position.
Here’s the Block Diagram we used before, with the labels changed to represent the car-on-windy-freeway control loop.
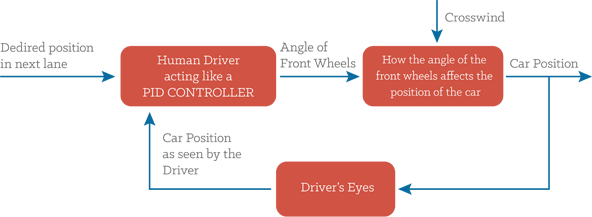
Notice how important closing the feedback loop is. If we removed the feedback loop we would be in “open loop control”, and would have to control the car’s position with our eyes closed!
Thankfully we are under “Closed loop control” -using our eyes for position feedback.
As we saw in the house-temperature example the controller takes the both the PV and SP signals, which it then puts through a black box to calculate a controller output. That controller output is sent to an actuator which moves to actually control the process.
We are interested here in what the black box actually does, which is that it applies 1, 2 or 3 calculations to the SP and Measured PV signals. These calculations, called the “Modes of Control” include:
- Proportional (P)
- Integral (I)
- Derivative (D)
Tomorrow: Under the hood of the PID Controller
I'll Give You All The Tools And Training You Need To Tune Your PID Loop - From Just $97
Click Here to Order
“Its power and utility is embedded in its simplicity.
Your Blueprint launched our process from ‘expect the worst, but hope for the best’ process to one that is reliable and predictable. ”